The Zaslavsky web map generator
The equations
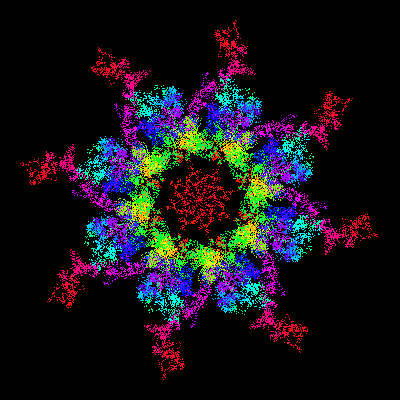
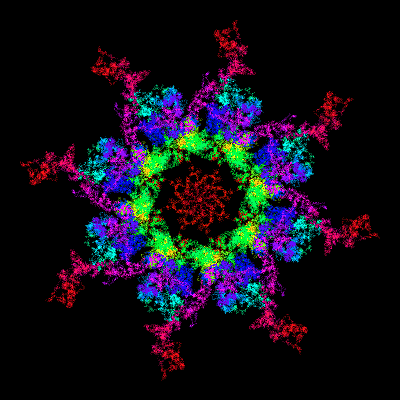
This script draws fractal images using the Zaslavsky web map:
x1 = (x0 + K sin(y0)) cos(α) + y0 sin(α)
y1 = -(x0 + K sin(y0)) sin(α) + y0 cos(α)
The image is sensitive to infinitesimal changes to the initial conditions. The spin buttons next to the parameter felds increment the last decimal place of the displayed number; for larger or smaller increments, add or remove a digit.
Oversampling starts with an enlarged array of image points, then reduces it to the size of the final image. The net effect is the recording of points at the subpixel level for increased resolution. For these images, a small amount of oversampling smooths the graininess and enhances fine detail; larger amounts start to blur the image. Recommended amounts are 2 for 400-800 pixel images, and 3 for 1000. In general, oversampling is better appreciated at large image sizes. Increasing the point density also smooths graininess, but it obscures fine detail.
|
|
The image grows as points are added, and the final result depends on the number of points (size2 × oversample2 × density); so these images cannot be scaled as the icon and Latööcarfian fractals can, and the ability to do a quick preview is limited. Quick draw generates all the points, but only displays a fraction of them based on the oversample level, and oversampling is not applied. The image will automatically draw with whichever mode is selected when the parameters are changed.
The information field displays the progress of the script. The final result consists of the number of generated points, the elapsed time, and the parameters in case you want to save them.
Colors are assigned in the order that the points are drawn, not by hit count as are the icons and Latööcarfian fractals. Several sample color palettes are provided. Make your own by entering hex color and percentile pairs, one per line; then press redraw palette. A color picker is provided to find hex color values. To apply the palette, redraw the image.
(The position numbers do not have to be percentiles; use any numbers and they will be normalized to 0-100. Omit the number and the color will be skipped. The entries do not have to be in order; you can reverse the numbers to reverse colors.)
Images differ in their pixel distributions; a given palette may need to be stretched in either direction for the best results.
When you are happy with the image, right-click the canvas to save it.